Control system was tested in flight
In June-July our flying testbeds (test rockets, designed for testing the control system (CS) in real flight) flew twice.
Earlier we described the design of CS and flying testbed. Like in April flights, we launched two versions of the CS - one developed using Arduino by outside specialist, and the other was produced completely inside Lin Industrial.
On June 12 a rocket was launched with Arduino-based CS (see photo of the launch at the beginning of the article). For the first time the entire flight program was executed without a glitch, namely the ignition of pair of motors on the ground (RD1-300M with total impulse of 300 N·s each, from Kirov), ignition of the other pair of motors after completion of burning of the first pair, and parachute deployment in the apogee.
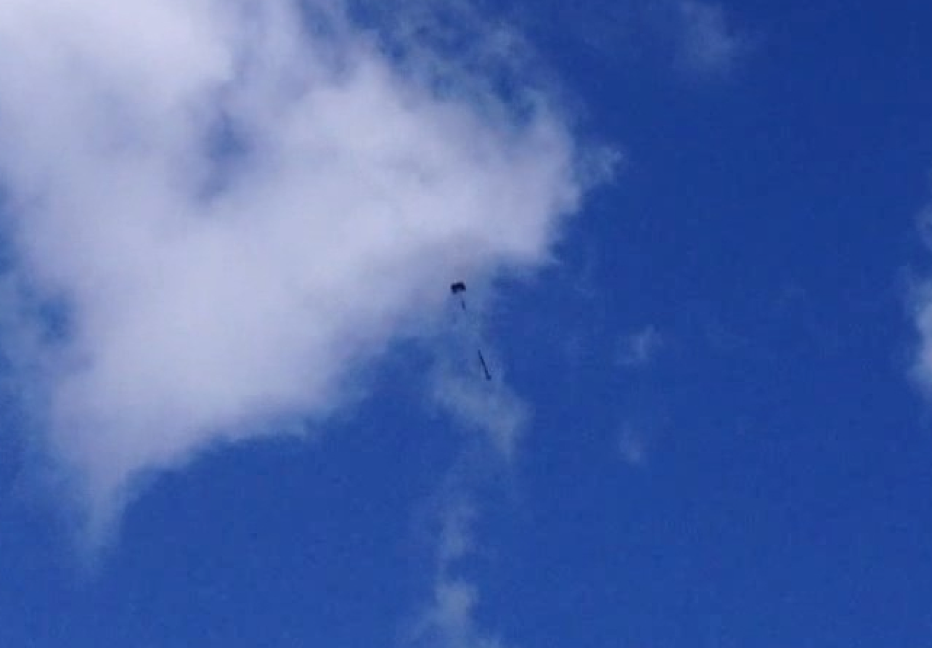
Unfortunately, one of two second-stage engines burned through, causing the rocket rotation seen on video.
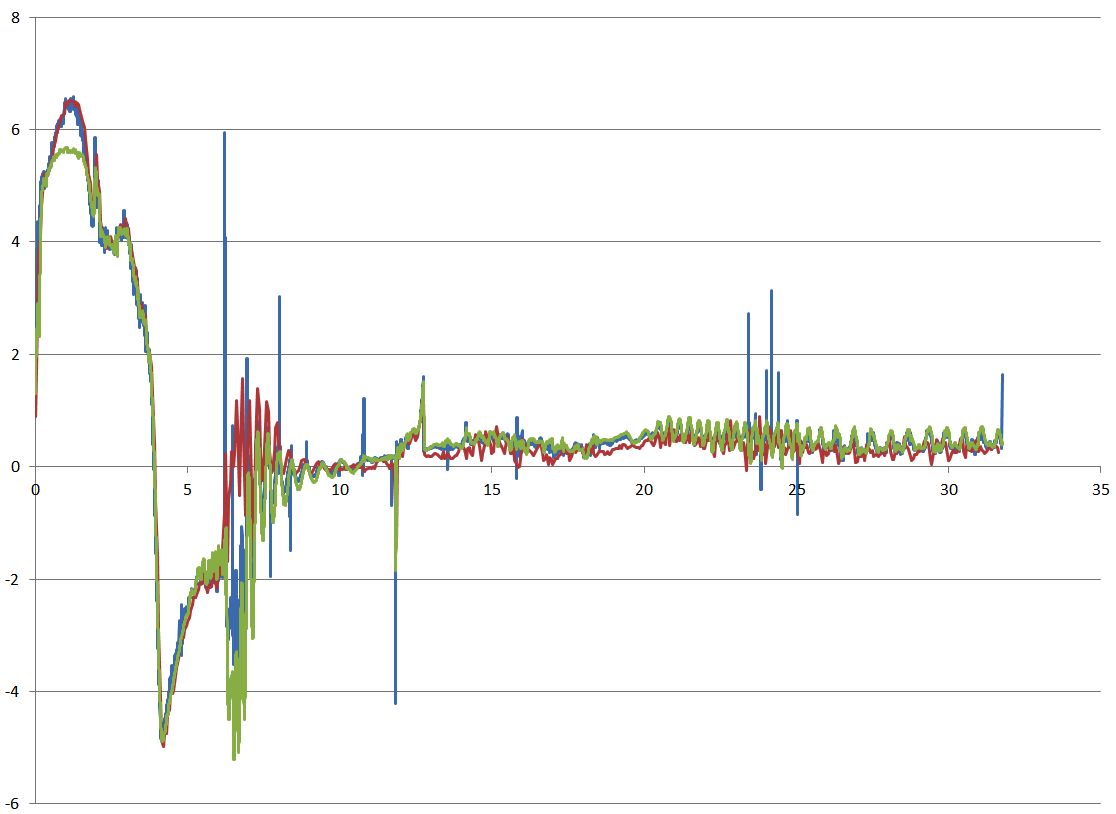
On the graph below we provided some data, obtained during the tests.
Angular velocity around the roll axis, degrees/sec
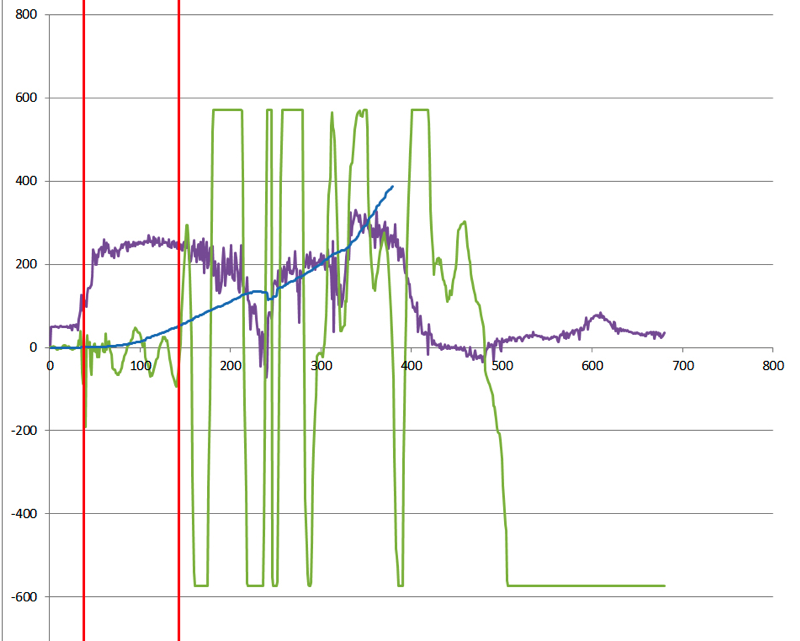
The graph shows:
• acceleration along the longitudinal axis of the rocket;
• dynamic pressure (proportional to the square of velocity, calculated with ~5% accuracy, since the velocity is obtained by integrating the acceleration along the longitudinal axis of the rocket);
• angular velocity around the roll axis, i.e. angular velocity of the rocket rotation around the longitudinal axis.
The angular velocity is shown in degrees/sec, all the rest quantities are in arbitrary units for comparison. Red vertical lines enclose 1-second period after the rocket left the launch rail. During this period angular velocity fluctuations don't reduce, and also don't increase. But then something happens, and the CS can not cope with it - angular velocity fluctuations sharply increase, and so sharply that in moments of maximum increase the gyroscope gets saturated (this is seen as clipped peaks of angular velocity graph).
On the third second a motor burned through, the rocket started rotating, the axes began to shuffle, so further interpretation of the graph is complicated.
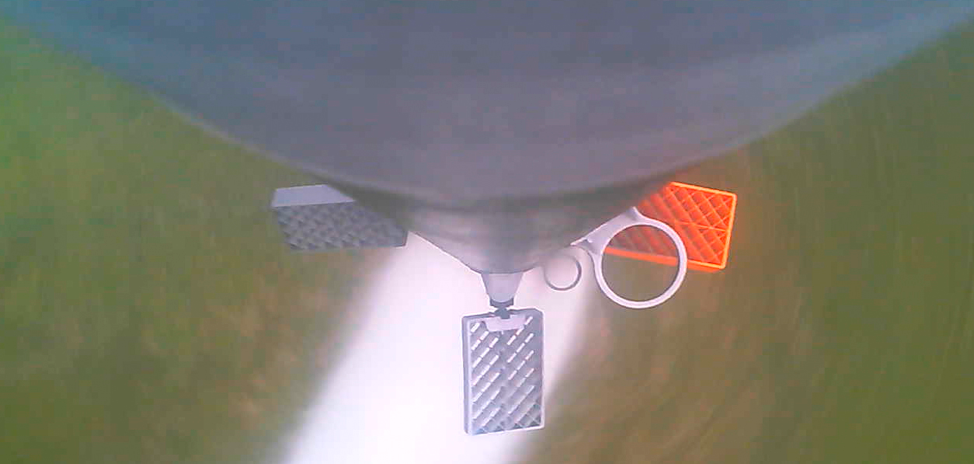
We had several versions of why the CS failed after the first second of flight. For example, an occasional powerful wind gust or a problem with the CS. Or resilience of rudders and slow operation of servos. For instance, the image below shows how the incident airflow turns the rudders when the rocket flies sideways after one of the motors burned through.
We solved this problem by replacing the servos with stronger ones - with hard metal shafts on two bearings.
Still, the primary version was different. Analysis of six flight records showed that the loss of stability occurred at the same dynamic pressure. Since with increasing dynamic pressure driving torque increases for the same deflection angle, then driven oscillation frequency also increases with increasing velocity. Simply put, at lower velocities rudders should be deflected by larger angle, to make incident airflow turn the rocket into the desired attitude. But if we start rotating the rudders by large angles at high velocity, then instead of smooth turns around the longitudinal axis we will see the rocket is strongly twitching. Hence, rudder rotation angles need to be decreased as the rocket accelerates.
As a result, based on earlier flight data, Andrey Suvorov, the lead designer for control systems, introduced into the control law a coefficient inversely proportional to the dynamic pressure. The new formula needed to be coded in assembly language for the microcontroller, and that turned to be non-trivial.
First, the range of rocket speeds between 0 and 150 m/s was divided into 16 sections. As the rocket accelerated and decelerated the rudder deflection angle decreases and increases by 2 to 16 times of the initial (launch) value. At the time when a loss of stability occurred in earlier flights, the deflection angle became twice smaller than before, and at a speed exceeding 80 m/s - 16 times smaller than before.
To fly at speeds exceeding 150 m/s the rudder deflection angle needs to be even smaller, but we are unlikely to achive such speeds with a subsonic flying testbed.
Second, the controller controls the servos sending them pulse-width modulated signal. Simply put, the design is as follows. A servo is capable to receive signal from controller with period of 14 ms. If pulse duration is 1 ms, then rudder starts turning to -150 degrees position from zero, 1.5 ms - to zero, 2 ms - to +150 degrees. Turns to intermediate positions are also possible, depending on pulse width.
At the same time the CS may write a number between 0 and 1023 into compare register. The controller is designed so that it sequentially compares the register with a number from 0 to 1023, performing it in 14 ms. If the compare register holds a number greater than value of the counter, then pulse appears in the output, if less or equal - nothing appears. Therefore any pulse may last between 0 and 14 ms (encoded by number between 0 and 1023 in the register), though servo understands only pulses between 1 and 2 ms, so it makes sense to write only numbers between 73 and 146 into the register. This method of control is bad for it provides rudder positioning accuracy of 4 degrees. Earlier it was acceptable, but when it became clear that for high velocities the deflection angle needs to be 16 times smaller than at the moment of launch, the accuracy of 4 degrees became insufficient.
To improve accuracy, the period of comparison was reduced 4 times - from 14 ms to 3.5 ms (the controller allows to change this period, though not to any value, but with severe limitations). But since servo understands commands only when pulses come every 14 ms, we've had to pass only every fourth pulse to servo's terminals. ACcordingly, operating range for the compare register was increased from 73-146 to 292-584, enabling rudder positioning accuracy of about 1 degree.
As you can see the programming for microcontrollers has its own peculiarities. For the sake of simplicity we have omitted some details. For example, in reality pulse width is slightly greater than 1-2 ms. Also, one pair of rudders controls turning about roll and yaw axes and uses 10-bit control (0-1023), while the other pair controls only pitch and uses 8-bit control (0-256). To avoid confusion in the names of the axes of the rocket, see our memo.
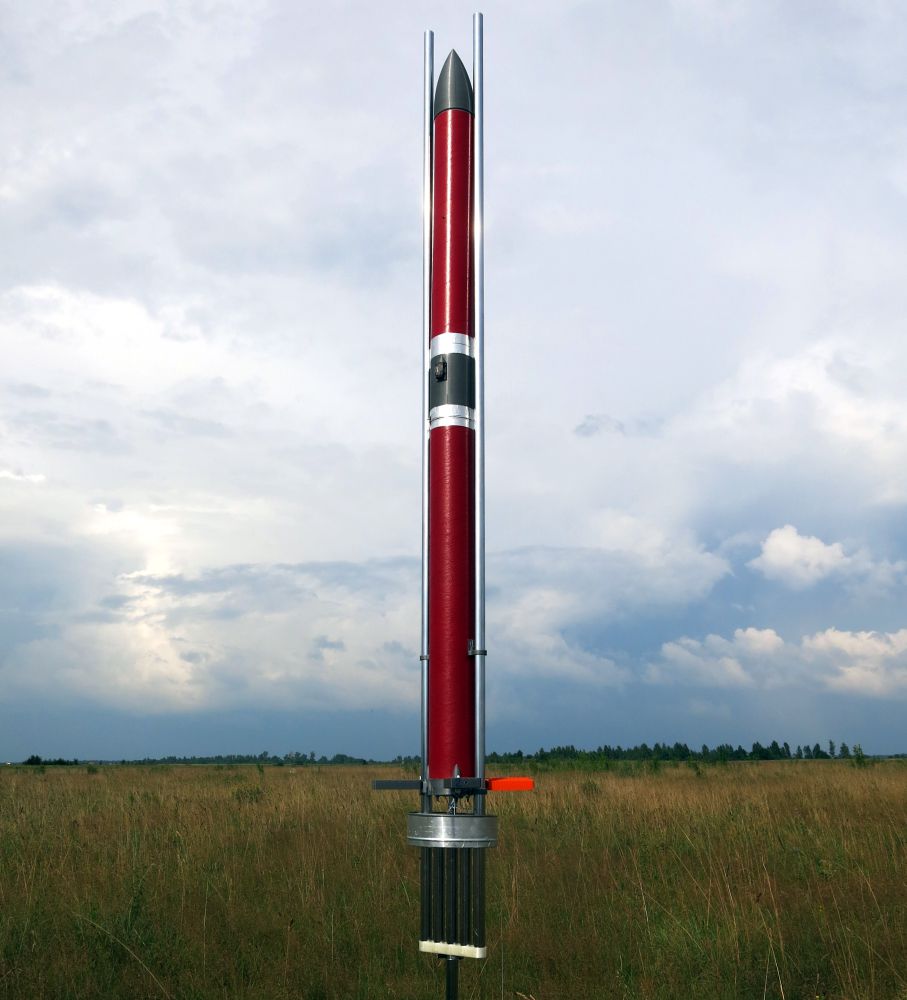
On July, 20 after completing all modifications the second flying testbed was set on the launch pad.
The rocket liftoff was flawless. Alas, the joy was marred by the fact that due to a launch preparation error the fairing separated as soon as the motors stopped burning, and then the parachute was torn off. As a result the rocket suffered hard landing.
The graph below shows acceleration along the rocket longitudinal axis according to three accelerometers: external, internal and additional AltimeterThree accelerometer.
Acceleration, g
Flight time, sec
Colors indicate acceleration according to data from CS internal accelerometer, CS external accelerometer and AltimeterThree device
The second pair of motors have ignited at T+1.75 seconds and completed their burn at about T+3.75 seconds. At T+5.85 the fairing has separated. At T+12 ejection charge igniter of the parachute has been activated, and the rocket has landed at T+31 seconds.
The graph below shows the flight segment before the fairing separation according to three accelerometers.
Acceleration, g
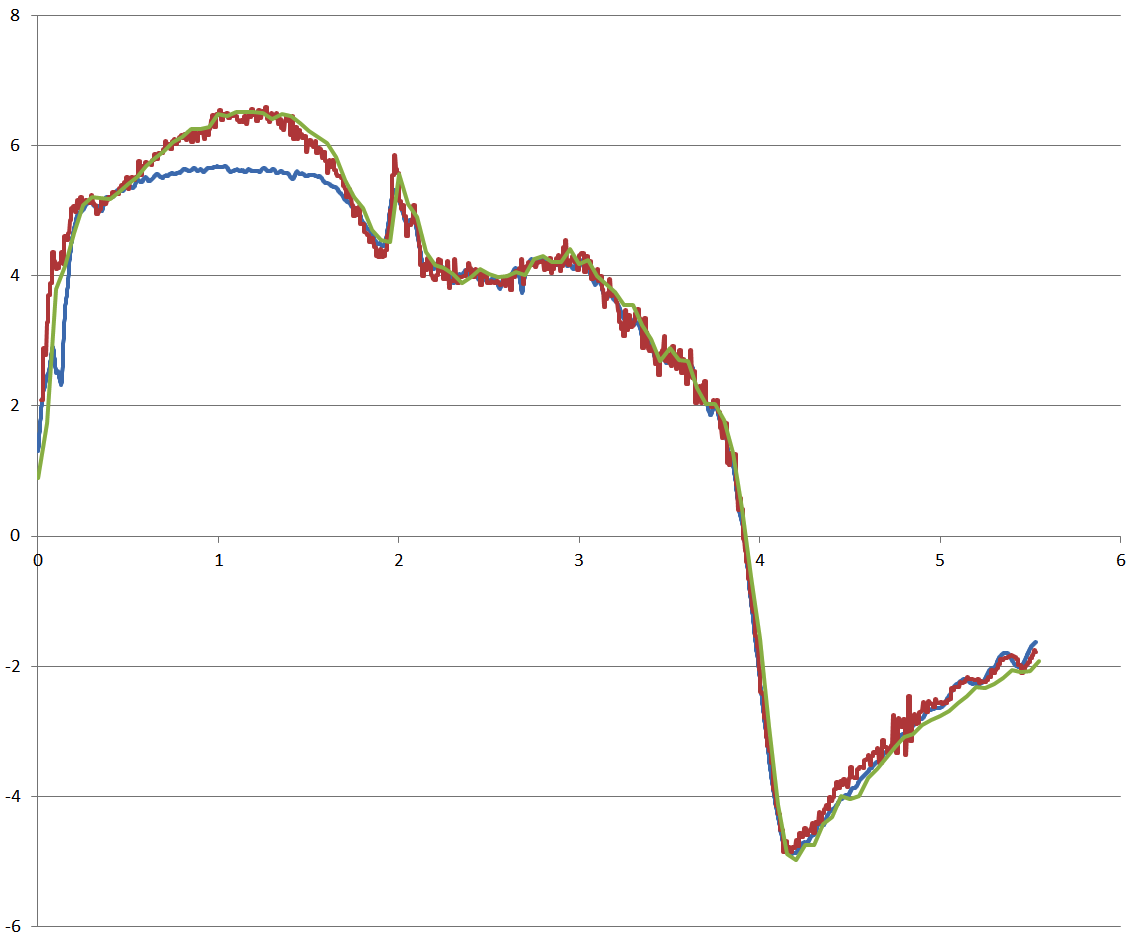
Flight time, sec
Colors indicate acceleration according to data from CS internal accelerometer, CS external accelerometer and AltimeterThree device
During the period between T+0.5 seconds and T+1.75 you can see that ADIS16445 internal accelerometer reading went almost flat - it got saturated, since it wasn't designed to measure accelerations above 5g. During such periods the CS uses external accelerometer data.
At T+2.0 you can see the activation of second-stage igniters, followed by smooth thrust of the motors, though acceleration is much smaller than during the first stage burn, due to the increase of air drag.
At T+4.0 the motors are still producing thrust, but it is smaller than air drag, so the rocket decelerates.
Maximum deceleration occurs at T+4.25 seconds - the motors completed their burning, velocity is still high, so deceleration caused by air drag is maximal. Then it gradually decreases along with velocity decrease.
The graph shows that data from all three accelerometers are in good agreement (with the exception of saturation period for the internal accelerometer). AltimeterThree reading curve is much smoother, and not because the device has good algorithm with noise filtering, but because it is polled less frequently (our accelerometers are polled with a frequency of 819.2 Hz and 100 Hz, while AltimeterThree - only with 20 Hz). That's why during sharp changes of acceleration data from this device may be less accurate.
Maximum flight altitude - 577 m.
Altitude, m
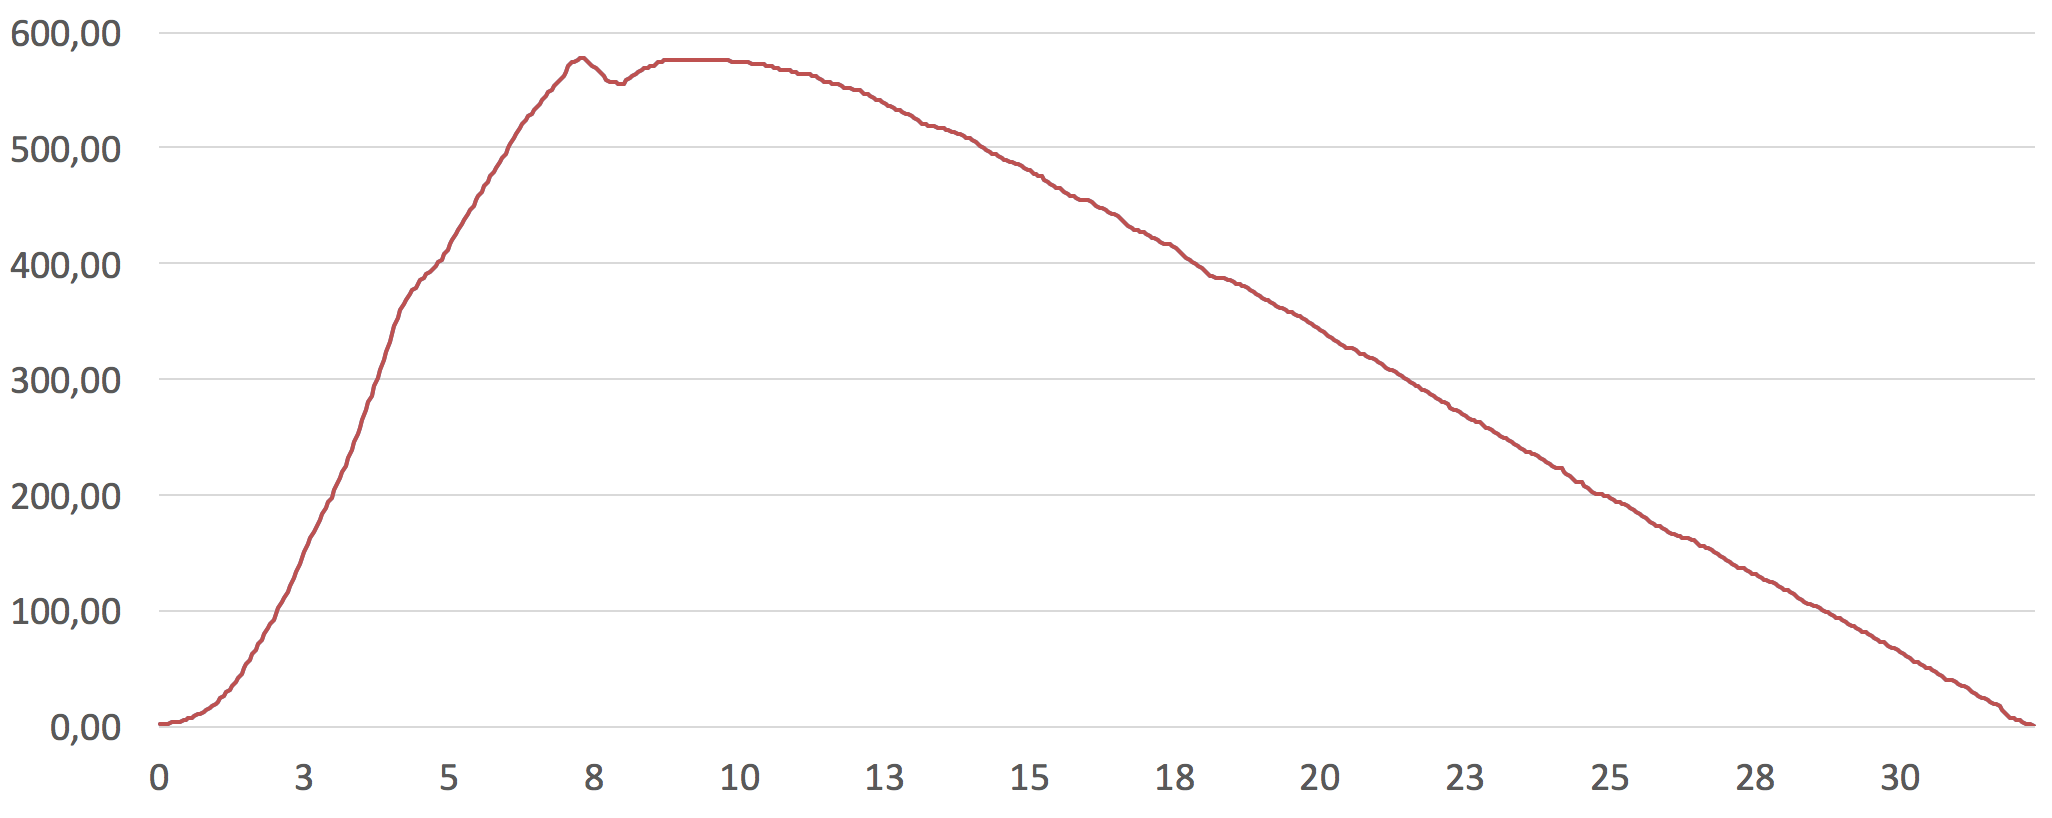
Flight time, sec
The data on the control system behavior in flight is currently being processed. The test results will be taken into account for upcoming flights.
In our immediate launch plans: flight of a two-stage supersonic rocket, first without CS, then with CS onboard, and also introducing of pitch control program in the CS (in other words, the rocket will be able to fly not just vertically) and sun sensor (having detected the sun in specific position the rocket will understand it reached the desired point of the flight path and will shutdown the engine).